

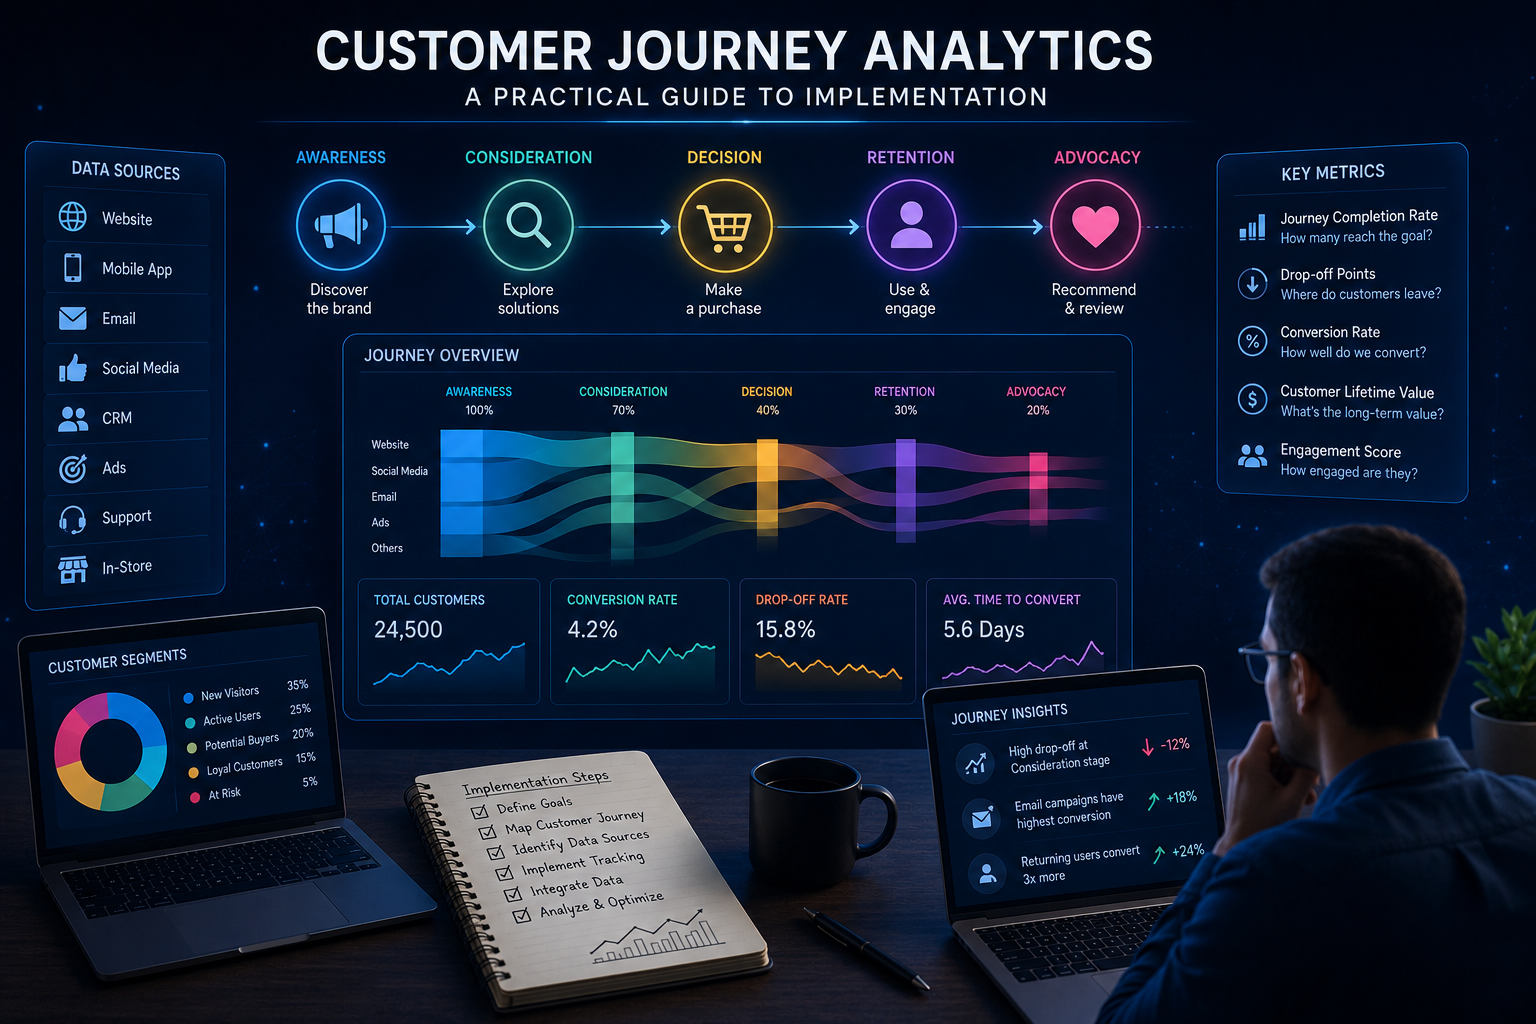
Most large organizations don’t struggle to collect customer data — they struggle to connect it. Web analytics live in one system, app behavior in another, and customer service interactions somewhere else entirely. Customer Journey Analytics exists to solve that fragmentation, bringing cross-channel data together so teams can understand not just what customers did, but the full path that led them there.
This guide covers what Customer Journey Analytics actually does, the practical steps to implementing it well, and real lessons from an enterprise rollout — Wyndham Hotels & Resorts’ expansion from standard web analytics into a unified, cross-channel journey view.
What Customer Journey Analytics Actually Solves
Traditional analytics tools are typically built around individual channels or sessions. That works fine for measuring a single webpage’s performance, but it falls apart when a customer’s actual experience spans a website visit, a mobile app session, a customer service call, and an in-person interaction — all connected to the same underlying relationship.
Customer Journey Analytics is designed to unify that fragmented picture. Rather than treating each channel as a separate dataset, it brings behavioral, technical, and business data together into one connected view of the end-to-end journey. The result is visibility not just into individual touchpoints, but into how those touchpoints relate to each other and influence the outcome that matters — whether that’s a completed purchase, a support resolution, or continued loyalty.
Why Implementation Approach Matters More Than the Tool Itself
Choosing to adopt journey analytics is the easy part. How an organization implements it determines whether the rollout delivers value in weeks or drags on for a year without anyone touching a usable dashboard.
A few factors shape how difficult or smooth this process is:
- Data maturity. Organizations with well-established, trusted data structures have a real head start over those starting from scratch.
- Governance requirements. Larger enterprises, especially those operating across many brands or regions, need implementation approaches that respect existing compliance and data governance rules rather than working around them.
- Existing architecture. Rebuilding a tagging framework or introducing manual data pipelines from the ground up adds significant time and engineering burden compared to extending what’s already trusted and in place.
The organizations that see the fastest time-to-value tend to prioritize preserving continuity with their existing data investments rather than treating implementation as a rebuild from zero.
A Real-World Example: Wyndham Hotels & Resorts
Wyndham Hotels & Resorts, which operates more than 20 global brands, faced a familiar challenge at enterprise scale: guest journeys were becoming more dynamic and cross-channel, and the company’s existing analytics setup needed to evolve to keep pace. Wyndham expanded from standard web analytics into Adobe Customer Journey Analytics, bringing cross-channel data together within Adobe Experience Platform to build a more complete view of the guest journey.
To accelerate the rollout, Wyndham worked with Quantum Metric, an Adobe technology partner, using a direct connector between Quantum Metric and Adobe Experience Platform alongside Adobe’s Web SDK. This let the team prepare and stream data into the platform without rebuilding its existing tagging framework or introducing new manual processes to move data around. According to the company, schema setup was completed in roughly two days, and the broader migration into Customer Journey Analytics proceeded smoothly enough that the team could start activating insights with fewer resources than a full rebuild would have required.
The behavioral signals captured through this approach — including errors, performance issues, and points of friction in the guest experience — became visible directly within journey analytics dashboards, with the option to dig deeper into specific issues for diagnostic detail. The overall rollout moved from initial implementation to actionable insight in approximately 45 days, a timeline made possible largely by reusing existing, trusted data structures instead of starting over.
The broader result was increased visibility across marketing, product, analytics, and technology teams, all working from a shared, unified view of the guest journey rather than siloed, channel-specific reports.
The Core Steps to a Successful Implementation
Drawing from this kind of enterprise rollout, a few consistent steps separate implementations that deliver value quickly from those that stall:
- Audit and preserve existing data structures before rebuilding anything. Most organizations already have a trusted data layer. Extending it is almost always faster and less risky than starting fresh.
- Use connectors and existing SDKs rather than manual data pipelines. Manual ETL processes introduce ongoing engineering overhead and slow down every future change. Where a direct connector or existing web SDK can move data automatically, it removes a significant source of friction.
- Map behavioral and technical signals into a standardized schema early. Structuring data consistently from the start — rather than retrofitting structure later — makes it usable across teams and tools from day one.
- Bring in behavioral context alongside standard analytics. Traditional journey data tells you what happened. Behavioral signals like friction points, errors, and performance issues tell you why, which is often the more actionable insight.
- Prioritize speed to first insight over full-scope perfection. Rolling out core capabilities quickly and expanding domains and use cases afterward tends to outperform trying to solve every use case before anything goes live.
What Good Cross-Channel Visibility Actually Enables
Once behavioral, performance, and business data are unified in one system, the practical value shows up across several teams simultaneously, not just within analytics:
- Marketing teams can build more accurate audience segments and personalize outreach based on actual behavior rather than assumptions.
- Product teams can identify friction points and prioritize fixes based on real impact on the customer journey, not guesswork.
- Analytics and technology teams gain a single source of truth instead of reconciling conflicting numbers from separate tools.
- Experience and CX teams get visibility into the “why” behind customer behavior, not just the “what,” which is what actually drives meaningful optimization.
This shared visibility is often what separates organizations that treat customer experience improvement as a coordinated effort from those where every team is optimizing in isolation with incomplete information.
Best Practices for Rolling Out Customer Journey Analytics
- Start with what you already trust. Existing, well-governed data structures are an asset, not a constraint to work around.
- Choose connectors and SDKs over custom-built data pipelines wherever a reliable option already exists for your platform.
- Bring behavioral and diagnostic signals into the same view as standard journey data, rather than treating friction and performance monitoring as a separate discipline.
- Roll out in phases, prioritizing the domains and use cases that deliver the fastest visible value before expanding scope.
- Treat the rollout as a cross-team initiative from the start, since the value of unified data compounds when marketing, product, and analytics teams are all working from the same view.
Common Mistakes to Avoid
- Rebuilding tagging and data infrastructure from scratch when existing structures could be extended instead, adding unnecessary time and engineering cost.
- Relying on manual data pipelines that create ongoing maintenance burden and slow down every future change to the data model.
- Treating journey analytics as a reporting upgrade only, rather than a foundation for personalization, segmentation, and optimization across the broader marketing and experience stack.
- Keeping behavioral and diagnostic data siloed from core analytics, which limits teams to knowing what happened without understanding why.
- Trying to launch every domain and use case simultaneously, which extends timelines without meaningfully improving the end result.
Key Takeaways
- Customer Journey Analytics unifies fragmented, channel-specific data into one connected view of the customer journey, revealing not just what happened but why.
- Implementation speed depends far more on preserving and extending existing trusted data structures than on the specific tools chosen.
- Connectors and existing SDKs reduce engineering burden significantly compared to manual data pipelines, often cutting rollout time from months to weeks.
- Behavioral signals like friction points, errors, and performance issues add critical context that standard journey data alone doesn’t provide.
- Cross-team visibility — spanning marketing, product, analytics, and technology — is where the real value of unified journey data shows up.
Frequently Asked Questions
What’s the difference between standard web analytics and Customer Journey Analytics? Standard web analytics typically measures behavior within a single channel or session. Customer Journey Analytics connects data across multiple channels and touchpoints into one unified view, revealing the full path a customer takes rather than isolated snapshots of individual interactions.
How long does a Customer Journey Analytics implementation typically take? Timelines vary significantly based on data maturity and existing architecture, but organizations that extend trusted, existing data structures rather than rebuilding from scratch can move from implementation to actionable insight in a matter of weeks rather than months.
Do we need to rebuild our tagging framework to implement journey analytics? Not necessarily. Where a direct connector or existing web SDK is available, organizations can often prepare and stream data into a journey analytics platform without rebuilding tagging infrastructure or introducing manual processes.
Why does behavioral data matter alongside standard analytics? Standard analytics shows what customers did. Behavioral signals — friction points, errors, and performance issues — help explain why they did it, which is often the insight that actually drives meaningful product and experience improvements.
Which teams benefit most from unified customer journey data? Marketing, product, analytics, and technology teams all benefit, since a shared, unified view eliminates the need to reconcile conflicting numbers from separate tools and lets every team work from the same understanding of the customer journey.
Conclusion
Customer Journey Analytics delivers the most value when implementation focuses on extending what an organization already trusts rather than rebuilding from the ground up. Enterprise rollouts that move quickly — like Wyndham’s expansion into cross-channel journey analytics — tend to share the same pattern: reuse existing data structures, bring in behavioral context alongside standard metrics, and prioritize getting to actionable insight quickly over achieving full scope on day one. Done well, the result isn’t just better reporting — it’s a shared foundation that lets marketing, product, and analytics teams finally work from the same understanding of the customer.








Leave a Reply